Press
Press & media kit
Basket Report — the Grocery Price Index is a free, citable source for what staple groceries cost in the United States right now. Everything here is built from public-domain U.S. government data and is free to quote, chart, and embed — no permission needed, no paywall, no login. If you need a number, a chart, or the raw data for a story, this page has it.
The number to quote
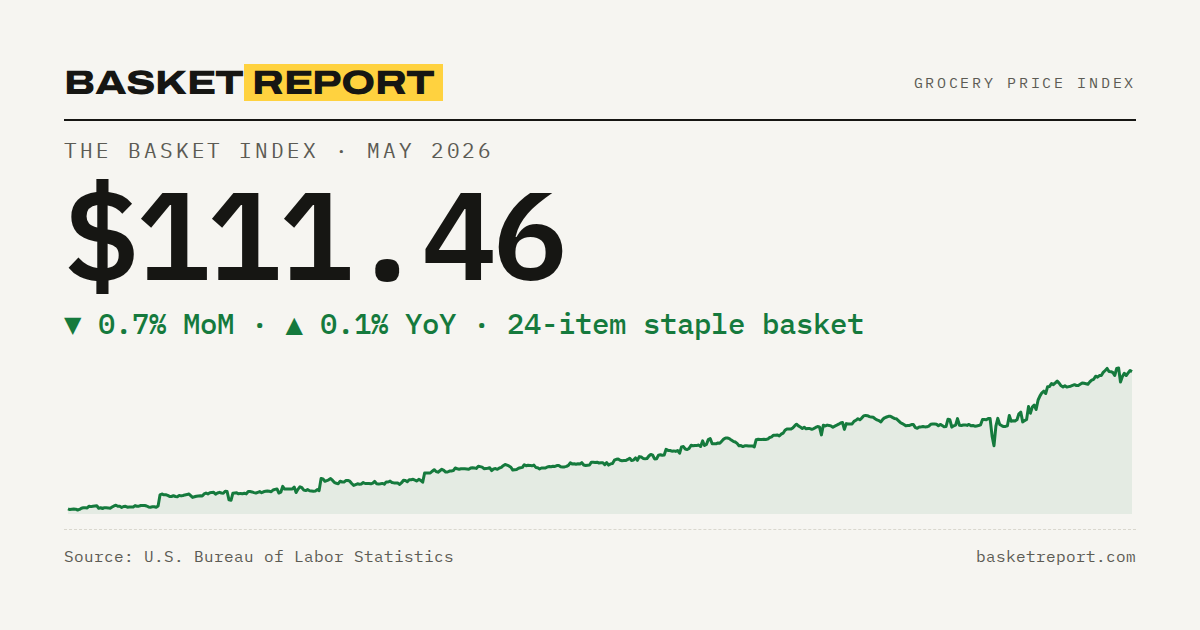
The Basket Index — the cost of a fixed-weight 24-item staple grocery basket at the U.S. city average — was $111.46 in May 2026, down 0.7% from the previous month and up 0.1% from a year earlier, based on U.S. Bureau of Labor Statistics average price data.
Canonical link: basketreport.com/basket/ — the page updates automatically each month within hours of the BLS Consumer Price Index release. The headline figure is a fixed-weight basket (the same items and quantities every month), so a change reflects price, not a change in mix. See the full methodology and the 24-item list.
Embed a live chart
Each chart is a static, JavaScript-free SVG that renders inside an <iframe> and links
back to the source page. Paste a snippet into any CMS or article. The image refreshes when the data does.
The Basket Index
Eggs — $2.19 per dozen (▼ 51.8% YoY)
Milk — $4.22 per gallon (▲ 4.8% YoY)
Coffee — $9.51 per pound (▲ 19.9% YoY)
Every one of the 24 items has its own embeddable chart at /prices/.
Download data & share cards
Researchers cite what they can download. Every series ships as CSV and JSON with a header line naming the BLS series ID and the retrieval date; each chart also has a 1200×630 share-card PNG.
- Basket Index: CSV · JSON · share card (PNG)
- Per-item data: linked from every item page (e.g. eggs.csv, eggs.json)
- Regional baskets: the four census regions at /regions/
- Everything in one place: the full catalogue, BLS series-ID map, and a machine-readable index at /data/
Story angles we can source on request
- This month’s biggest movers — which staples rose or fell most, in dollars and percent.
- Record highs and lows for any item, with the dates, back to 1980.
- “Real” (inflation-adjusted) prices alongside nominal, for any item or the basket.
- How a staple basket differs across the Northeast, Midwest, South, and West.
- Custom comparisons against a past baseline (e.g. vs. 2019, vs. the 2022 peak).
How to cite
Attribution to Basket Report is appreciated but not required: the underlying data is a work of the U.S. government and in the public domain. Suggested citation:
Basket Report, "The Basket Index," U.S. Bureau of Labor Statistics, CPI Average Price Data. basketreport.com (retrieved 2026-06-21).
Please attribute the underlying prices to the U.S. Bureau of Labor Statistics, CPI Average Price Data; the Basket Index itself is our derived analysis, computed from unaltered BLS prices. Text attribution only — there is no BLS logo and BLS does not endorse Basket Report.
Contact
Press, interviews, a custom cut of the data, or a number you can’t find — email [email protected], or see the contact page. We can usually turn a reporter request around the same day, and we send a short note the morning the monthly CPI lands — ask to be added to the list.